The Balance Sheet, Income Statement, and Cash Flow Statement
- -->> 10. The Balance Sheet, Income Statement, and Cash Flow Statement
What you'll learn
 Balance Sheet AnalysisIncome Statement InterpretationCash Flow Statement FundamentalsInterconnectedness of Financial Statements
Understanding a company's financial health is paramount for investors, business owners, and even employees. Far from being arcane documents, the Balance Sheet, Income Statement, and Cash Flow Statement are the three core financial reports that, when interpreted together, paint a comprehensive picture of an organization's performance and position. These reports are often referred to as the "financial trio," and learning to read and connect them is a fundamental skill for anyone looking to make informed financial decisions. This article will demystify these essential statements, guiding you through their individual purposes and, crucially, how they work in concert to reveal the true story of a business.
The Balance Sheet: A Snapshot in Time
Imagine a photograph of a company's financial standing at a specific moment. That's precisely what the Balance Sheet represents. It provides a snapshot of what a company owns (assets), what it owes (liabilities), and the owner's stake (equity) at the close of a reporting period, typically the end of a quarter or fiscal year. Its fundamental principle is encapsulated by the accounting equation: Assets = Liabilities + Equity. This equation must always balance, providing a critical check on the accuracy of the statement.
Assets are resources controlled by the company from which future economic benefits are expected. They can be current assets, like cash, accounts receivable, and inventory, which are expected to be converted into cash within one year, or non-current assets, such as property, plant, and equipment (PP&E), which have a longer useful life.
Liabilities represent the company's obligations to external parties. Current liabilities, like accounts payable and short-term loans, are due within one year, while non-current liabilities, such as long-term debt and deferred tax liabilities, extend beyond that timeframe.
Equity, also known as owner's equity or shareholders' equity, is the residual value of assets after all liabilities are deducted. It represents the ownership interest in the company and includes elements like common stock and retained earnings.
- Assets: What the company owns (e.g., Cash, Inventory, Equipment).
- Liabilities: What the company owes (e.g., Accounts Payable, Loans).
- Equity: The owners' claim on assets after liabilities are paid (e.g., Retained Earnings, Common Stock).
By analyzing the Balance Sheet, one can assess a company's financial strength, liquidity (ability to meet short-term obligations), and solvency (ability to meet long-term obligations). A healthy balance sheet shows a good mix of assets, manageable debt, and solid equity.
The Income Statement: A Story of Performance
While the Balance Sheet offers a static view, the Income Statement, also known as the Profit & Loss (P&L) Statement, tells a dynamic story over a period of time, typically a quarter or a year. It measures a company's financial performance by detailing its revenues and expenses, ultimately revealing whether the company made a profit or incurred a loss during that period. It's often referred to as "the story of how much money a company made or lost."
The Income Statement begins with revenue, which is the total amount of money generated from sales of goods or services. From this, the cost of goods sold (COGS) is subtracted to arrive at gross profit. COGS includes the direct costs attributable to the production of the goods or services sold by a company.
Operating expenses, such as selling, general, and administrative (SG&A) expenses, research and development (R&D), and depreciation, are then deducted from gross profit to yield operating income. This figure indicates the profitability of a company's core operations.
Finally, non-operating items like interest expense and taxes are considered, leading to the bottom line: net income (or net loss). Net income is arguably the most watched figure on the Income Statement, as it represents the total profit available to shareholders.
- Revenue: Total sales generated from business activities.
- Cost of Goods Sold (COGS): Direct costs to produce goods/services.
- Gross Profit: Revenue minus COGS.
- Operating Expenses: Costs of running the business (e.g., salaries, rent).
- Operating Income: Profit from core operations.
- Net Income: The ultimate profit after all expenses and taxes.
The Income Statement helps stakeholders understand a company's profitability trends, operational efficiency, and revenue generation capabilities. Steady growth in net income is generally a positive indicator, though it's crucial to examine the sources of that income.
The Cash Flow Statement: The Movement of Money
Profit on the Income Statement doesn't always translate directly into cash in the bank. This is where the Cash Flow Statement becomes indispensable. It tracks all cash inflows and outflows over a specific period, detailing how cash is generated and used by the company. It reconciles the difference between net income and the actual change in cash, providing a more accurate picture of a company's liquidity and solvency than the Income Statement alone.
The Cash Flow Statement is divided into three primary sections:
1. Cash Flow from Operating Activities: This section reports the cash generated or used by a company's core business operations. It starts with net income and adjusts for non-cash items (like depreciation and amortization) and changes in working capital (e.g., accounts receivable, inventory, accounts payable). Positive cash flow from operations is a strong indicator of a healthy, sustainable business.
2. Cash Flow from Investing Activities: This section details cash flows related to the purchase and sale of long-term assets and investments. Examples include buying or selling property, plant, and equipment, or investments in other companies. Large negative cash flow in this section might indicate significant capital expenditures for growth, which can be positive in the long run.
3. Cash Flow from Financing Activities: This section covers cash flows related to debt, equity, and dividends. It includes activities like issuing new stock or debt, repaying loans, and paying dividends to shareholders. Positive cash flow from financing could mean the company is raising capital, while negative cash flow might indicate debt repayment or dividend distributions.
Analyzing the Cash Flow Statement reveals a company's ability to generate cash internally, fund its growth, meet its obligations, and provide returns to shareholders. It is often considered the most reliable indicator of a company's financial health because cash is king; a company can be profitable on paper but still run out of cash.
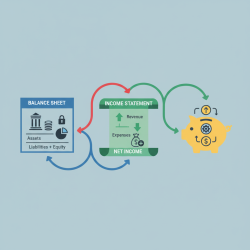
The Symphony of the Trio: Connecting the Dots
While each statement offers unique insights, their true power lies in their interconnectedness. They don't exist in isolation; changes in one statement invariably affect the others. For example, the net income from the Income Statement flows into the retained earnings section of the Equity portion of the Balance Sheet. The cash balance, which is the final figure on the Cash Flow Statement, is also the same cash balance reported on the Balance Sheet.
An increase in sales (Income Statement) would ideally lead to an in crease in cash (Cash Flow Statement) and a stronger asset base (Balance Sheet). Similarly, taking on debt (Cash Flow from Financing Activities) would increase liabilities (Balance Sheet). By comparing these statements across different periods and understanding their relationships, analysts can perform a comprehensive financial analysis, uncover trends, identify potential problems, and make more accurate forecasts.
Understanding these connections allows for a holistic view: a company might show high profits (Income Statement) but struggle with cash flow (Cash Flow Statement) due to long payment cycles from customers, impacting its ability to pay immediate bills (Balance Sheet). Conversely, a company might invest heavily in new equipment (Cash Flow from Investing Activities), temporarily reducing its cash, but building future asset value (Balance Sheet) to generate higher revenues later (Income Statement).
Summary
Interpreting your financial trio—the Balance Sheet, Income Statement, and Cash Flow Statement—is an essential skill for grasping the full financial narrative of any business. The Balance Sheet provides a static snapshot of assets, liabilities, and equity at a given point. The Income Statement outlines a period's revenues, expenses, and ultimate profitability. The Cash Flow Statement, crucial for understanding actual liquidity, details the movement of cash through operating, investing, and financing activities. Individually, they offer distinct perspectives, but together, they form an integrated and dynamic picture, revealing a company's financial health, performance, and sustainability, empowering users to make well-informed decisions.
Comprehension questions
 What is the fundamental accounting equation that the Balance Sheet adheres to, and what are its three main components?How does the Income Statement differ from the Balance Sheet in terms of the period it covers and the type of financial information it presents?Name the three primary sections of the Cash Flow Statement and briefly explain what each section reports.Explain how the net income from the Income Statement and the final cash balance from the Cash Flow Statement are connected to the Balance Sheet.
Review Quiz
Next Lesson

Course Contents : The Vital Importance of Keeping Good Records for Small Businesses
- >> 10.
 The Balance Sheet, Income Statement, and Cash Flow Statement